Dashboard
This topic describes how to view event logs, including attack and request statistics, event distribution, top 10 attacked domain names, top 10 attack source IP addresses, and top 10 attacked URLs in a specified time range, such as yesterday, today, past 3 days, past 7 days, or past 30 days.
Prerequisites
A domain name has been added and connected to WAF.
WAF protection is enabled.
At least one protection rule has been configured for the domain name.
Specification Limitations
On the Dashboard page, protection data of a maximum of 30 days can be viewed.
How to Calculate QPS
The QPS calculation method varies depending on the time range. For details, see Table 1.
Time Range | Average QPS Description | Peak QPS Description |
|---|---|---|
Yesterday or Today | The QPS curve is made with the average QPSs in every minute. | The QPS curve is made with each peak QPS in every minute. |
Past 3 days | The QPS curve is made with the average QPSs in every five minutes. | The QPS curve is made with each peak QPS in every five minutes. |
Past 7 days | The QPS curve is made with the maximum value among the average QPSs in every five minutes at a 10-minute interval. | The QPS curve is made with each peak QPS in every 10 minutes. |
Past 30 days | The QPS curve is made with the maximum value among the average QPSs in every five minutes at a one-hour interval. | The QPS curve is made with the peak QPSs in every hour. |
Note
Queries Per Second (QPS) indicates the number of requests per second. For example, an HTTP GET request is also called a query. The number of requests is the total number of requests in a specific time range.
Procedure
Log in to the management console.
Click
 in the upper left corner of the management console and select a region or project.
Click
 in the upper left corner and choose Web Application Firewall (Dedicated) under Security.
In the upper part of the page, specify the website, instance, and time range for your query.
By default, the information about all websites you add to WAF in all enterprise projects are displayed.
Domain Names: shows information about website domain names added to the WAF instance. Click View to go to the Website Settings page and view details about domain names of protected websites.
Query time: You can select Yesterday, Today, Past 3 days, Past 7 days, or Past 30 days.
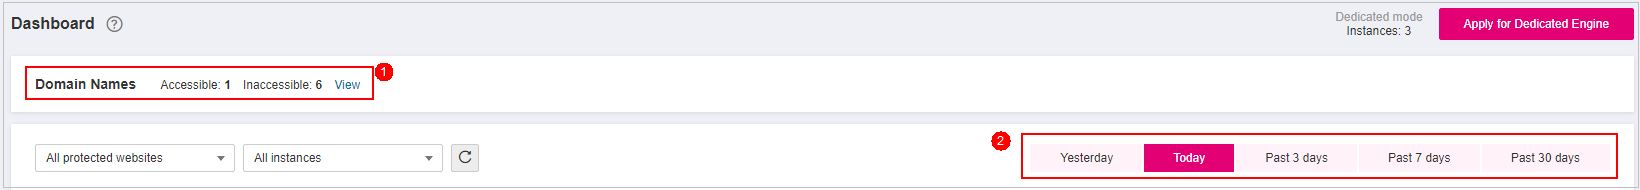
Figure 1 Setting search criteria
View how many requests, attacks, and pages under each type of attacks.
Requests: shows the page views of the website, making it easy for you to view the total number of pages accessed by visitors in a certain period of time.
Attacks: shows how many times the website are attacked.
You can view how many pages are attacked by a certain type of attacks within a certain period of time.

Figure 2 Protection action statistics
Query security data in the Security Event Statistics area.
By day: You can select this option to view the data gathered by the day. If you leave this option unselected, you have the following options:
Yesterday and Today: Security event data is gathered every 2 minutes.
Past 3 days: Security event data is gathered every 5 minutes.
Past 7 days: Security event data is gathered every 10 minutes.
Past 30 days: Security event data is gathered every hour.

Figure 3 Security Event Statistics
Table 2 Parameters in Security Event Statistics¶ Parameter
Description
Requests
You can view how many requests for your website as well as total attacks and attacks of each attack type.
QPS
Average number of requests per second for the domain name. For details about the values of QPS, see How to Calculate QPS.
Queries Per Second (QPS) indicates the number of requests per second. For example, an HTTP GET request is also called a query.
Bandwidth
Bandwidth usage
The value of sent and received bytes is calculated by adding the values of request_length and upstream_bytes_received by time, so the value is different from the network bandwidth monitored on the EIP. This value is also affected by web page compression, connection reuse, and TCP retransmission.
Event Distribution
Types of attack events
Click an area in the Event Distribution area to view the type, number, and proportion of an attack.
Top 10 Attacked Domain Names
The ten most attacked domain names and the number of attacks on each domain name.
Click View More to go to the Events page and view more protection data.
Top 10 Attack Source IP Addresses
The ten source IP addresses with the most attacks and the number of attacks from each source IP address.
Click View More to go to the Events page and view more protection data.
Top 10 Attacked URLs
The ten most attacked URLs and the number of attacks on each URL.
Click View More to go to the Events page and view more protection data.