Viewing Tracing Logs
After you enable CTS, the system starts recording operations on DBSS. Operation records for the last seven days can be viewed on the CTS console.
Viewing a DBSS Trace on the CTS Console
Log in to the management console.
In the navigation pane on the left, click
 and choose Management & Deployment > Cloud Trace Service.
Choose Trace List in the navigation pane.
Click Region at the top of the Trace List page to set the corresponding conditions.
The following four filters are available:
Trace Type, Trace Source, Resource Type, and Search By
Select the filter from the drop-down list. Set Trace Source to DBSS.
When you select Trace name for Search By, you also need to select a specific trace name.
When you select Resource ID for Search By, you also need to select or enter a specific resource ID.
When you select Resource name for Search By, you also need to select or enter a specific resource name.
Operator: Select a specific operator (a user other than tenant).
Trace Rating: Available options include All trace status, normal, warning, and incident. You can only select one of them.
In the upper right corner of the page, you can query traces in the last 1 hour, last 1 day, last 1 week, or within a customized period.
Click Query.
Click
 on the left of a trace to expand its details.
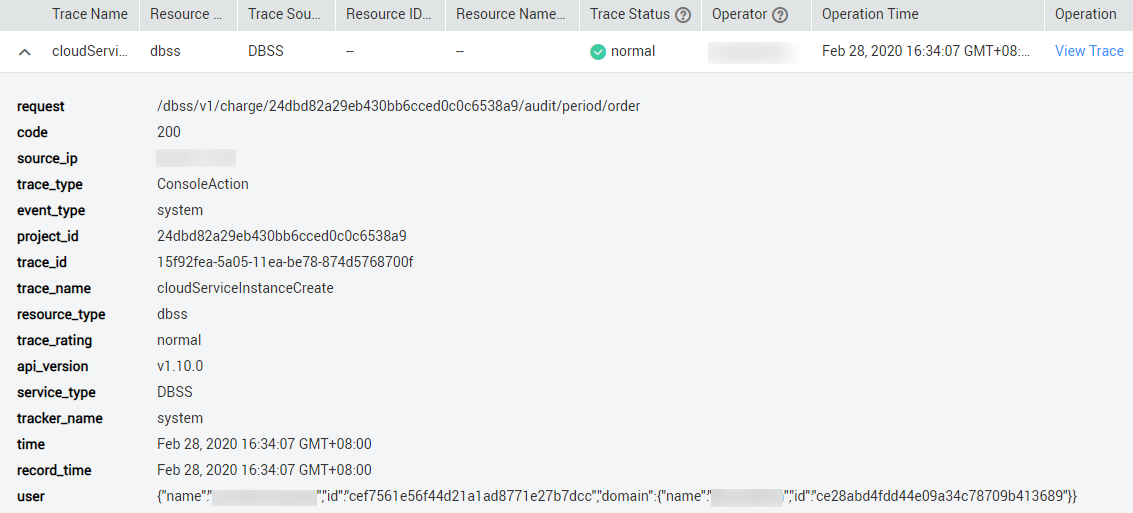
Figure 1 Expanding trace details
Click View Trace in the Operation column. On the displayed View Trace dialog box shown in Figure 2, the trace structure details are displayed.
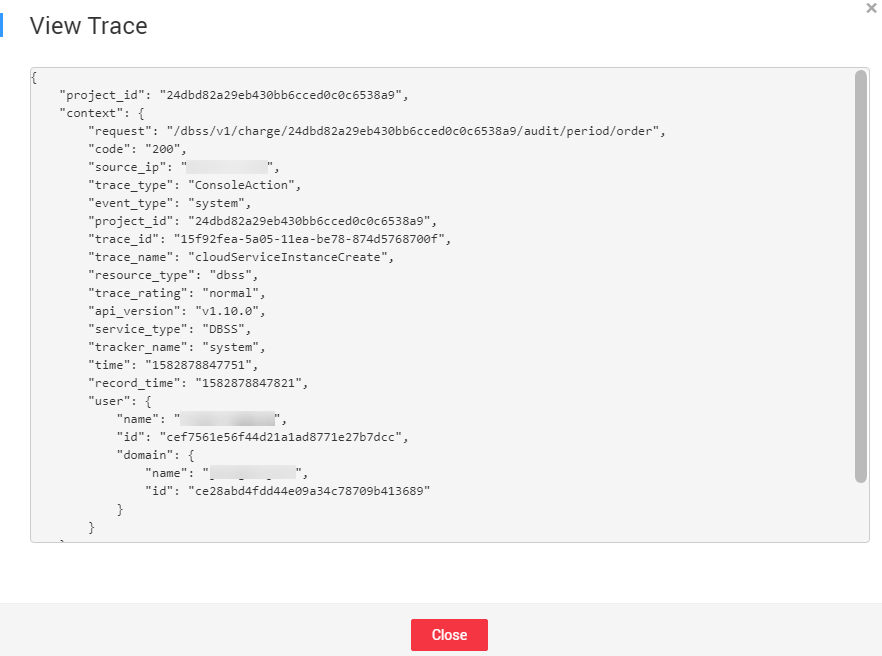
Figure 2 Viewing a trace